Your own pages and charts
You can add your own pages to the site, put links to them in the menu, and show charts anywhere: on your own pages, the About page, or a home page block. Every chart here works with both Highcharts and ECharts, because the skin draws it with whichever library chart_library picks. Switch libraries and your pages follow, with no changes.
Everything on this page is kept when you upgrade: it lives in your own files and in weewx.conf, never in the skin's.
| You want | Use |
|---|---|
| A link in the menu at the top of every page | menu.inc |
| A whole page of your own, such as a webcam page | Your own page |
| A new page of charts, with its own button on the Graphs page | A chart group with a button |
| Charts on the About page, the Records page, your own page or a home page block | showChart |
| A chart of numbers you have yourself, such as snowfall you measure by hand | draw_chart |
Add links to the menu
The menu at the top of every page (Home, Graphs, Records, Reports, About) can have your own links after About. Create a file called menu.inc in the Belchertown skin folder (where is it?) with one line per link:
<li class="menu-item"><a href="$relative_url/webcam/">Webcam</a></li>
<li class="menu-item"><a href="$relative_url/graphs/?graph=windpage">Wind</a></li>
<li class="menu-item"><a href="https://www.wunderground.com/dashboard/pws/YOURID" target="_blank">Weather Underground</a></li>
- Change the words between
>and</a>to what the menu should say. - For a page on your own site, start the address with
$relative_url/. The skin fills it in so the link works from every page, the home page and the pages in folders alike. - For another website, use its full address.
target="_blank"opens it in a new tab.
The links appear at the next report, on computers and in the phone menu. There's no need to restart weewx. Two or three extra links fit on most screens; more may wrap onto a second line on a small laptop.

A page of your own
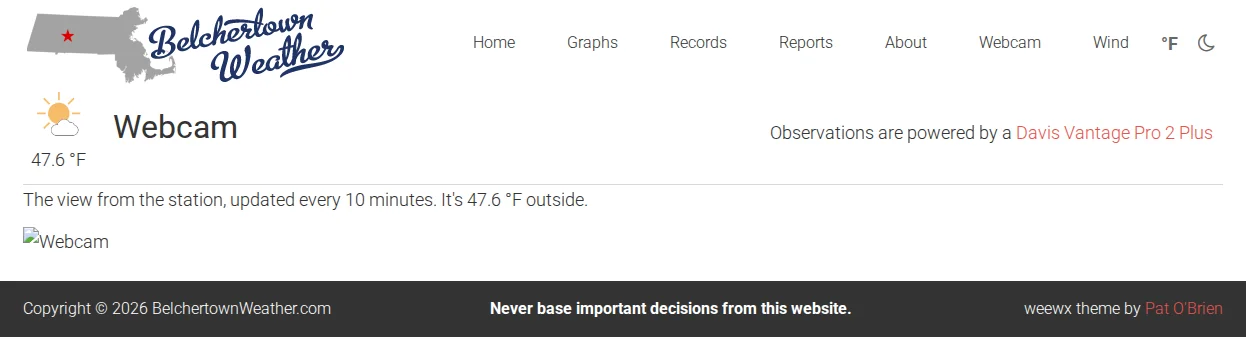
A page of your own looks like the rest of the site: the same header, menu, footer, light and dark theme. It takes three things: the page itself, one setting so weewx builds it, and a menu link. This example makes a Webcam page at webcam/ on your site.
1. Make the page. In the Belchertown skin folder, make a folder called webcam and, in it, a file called index.html.tmpl (package install shown):
cd /etc/weewx/skins/Belchertown
sudo mkdir webcam
sudo nano webcam/index.html.tmpl
Paste this in, and change the text and the picture's address to yours:
#errorCatcher Echo
#encoding UTF-8
#set global $page = "webcam"
#set global $page_header = "Webcam"

    #include "header.html.tmpl"

    <div class="site-inner">
        <main class="content">
            <article class="weewx about">

                    #include "page-header.inc"

                    <p>The view from the station, updated every 10 minutes. It's $current.outTemp outside.</p>
                    <img src="https://example.com/webcam/latest.jpg" style="max-width: 100%;" alt="Webcam">

            </article>
        </main>
    </div>

    #include "footer.html.tmpl"
Keep the lines that start with # as they are, except the two with webcam and Webcam: $page is a short name for the page (letters only), and $page_header is the heading shown at the top. Everything between page-header.inc and </article> is your page: text, pictures, weewx tags such as $current.outTemp, and charts.
2. Tell weewx to build it. Open weewx.conf and add these lines inside the [[Belchertown]] section, after the [[[Extras]]] part:
    [[Belchertown]]
        ...
        [[[CheetahGenerator]]]
            [[[[ToDate]]]]
                [[[[[webcam]]]]]
                    template = webcam/index.html.tmpl
Count the brackets: three, four, five. (For a second page, add another [[[[[name]]]]] block under the same [[[[ToDate]]]].) This adds your page to the skin's list of pages without changing skin.conf, so upgrades keep it. Then restart weewx.
3. Add it to the menu with menu.inc, as above:
<li class="menu-item"><a href="$relative_url/webcam/">Webcam</a></li>
After the next report, the page is at your site's address plus webcam/, for example http://raspberrypi.local/weewx/belchertown/webcam/.
Something went wrong?
- The page isn't there: check the brackets in
weewx.confand that you restarted weewx. The weewx log saysGenerated N files for report Belchertown; that number goes up by one with your page. - weewx won't start, or the log mentions
webcam/index.html.tmpl: a typo in the page. Copy the example again. A line of your own text that starts with#confuses weewx: don't start lines with#or$unless they're weewx tags. - The page has no styling: the page must be in a folder one level down (
webcam/index.html.tmpl), as in the example, for the skin's styles to be found.
Don't call Highcharts.chart() yourself
An older custom page may draw its chart with Highcharts.chart(...) or new Highcharts.Chart(...). That only works while chart_library = highcharts: with ECharts, Highcharts isn't loaded and the chart stays empty. Change Highcharts.chart(options) to draw_chart(options), as in the third example, and it works with both.
A page of charts on the Graphs page
Every chart group in graphs.conf with show_button = true gets a button on the Graphs page, and its own address: graphs/?graph= and the group's name. This group adds a Wind page with a short introduction above the charts:
[windpage]
    title = Wind
    show_button = true
    button_text = Wind
    page_content = "Wind at the station, from the anemometer on the roof at 30 feet."
    time_length = week

    [[windrose]]
        title = Wind Rose, Past Week
        [[[windRose]]]

    [[windspeed]]
        title = Wind Speed, Past Week
        aggregate_type = max
        aggregate_interval = hour
        [[[windGust]]]
        [[[windSpeed]]]
            type = area
After the next report, the button appears and https://www.example.com/graphs/?graph=windpage opens the page directly. page_content can hold HTML, such as a link or a picture. The chart gallery has charts to fill it with, and graphs.conf reference has every group setting. To make the page show up first on the Graphs page, set graph_page_default_graphgroup = windpage in [[[Extras]]].
Charts on the About page or a home page block
You can show charts on a page of your own and on any page that takes your own .inc file: the About page (about.inc), the Records page (records.inc), a home page block (home_<name>.inc) or one of the home page hooks. This example adds two charts to the About page.
-
In
graphs.conf, add a chart group for the page. Leave outshow_button, so it doesn't get a button on the Graphs page:[about] time_length = today gapsize = 300 [[abouttemp]] title = Temperature today [[[outTemp]]] [[aboutbaro]] title = Barometer today [[[barometer]]] -
In the Belchertown skin folder, open
about.incin a text editor (if you don't have one yet, copyabout.inc.exampletoabout.inc). -
Where each chart should appear, add an empty box whose
idis the chart's name from the double brackets. Then, after the boxes, add one line that loads the group:<div id="abouttemp" style="height: 400px;"></div> <div id="aboutbaro" style="height: 400px;"></div> <script>showChart("about");</script> -
Run
weectl report runor wait for the next report, and open the About page.
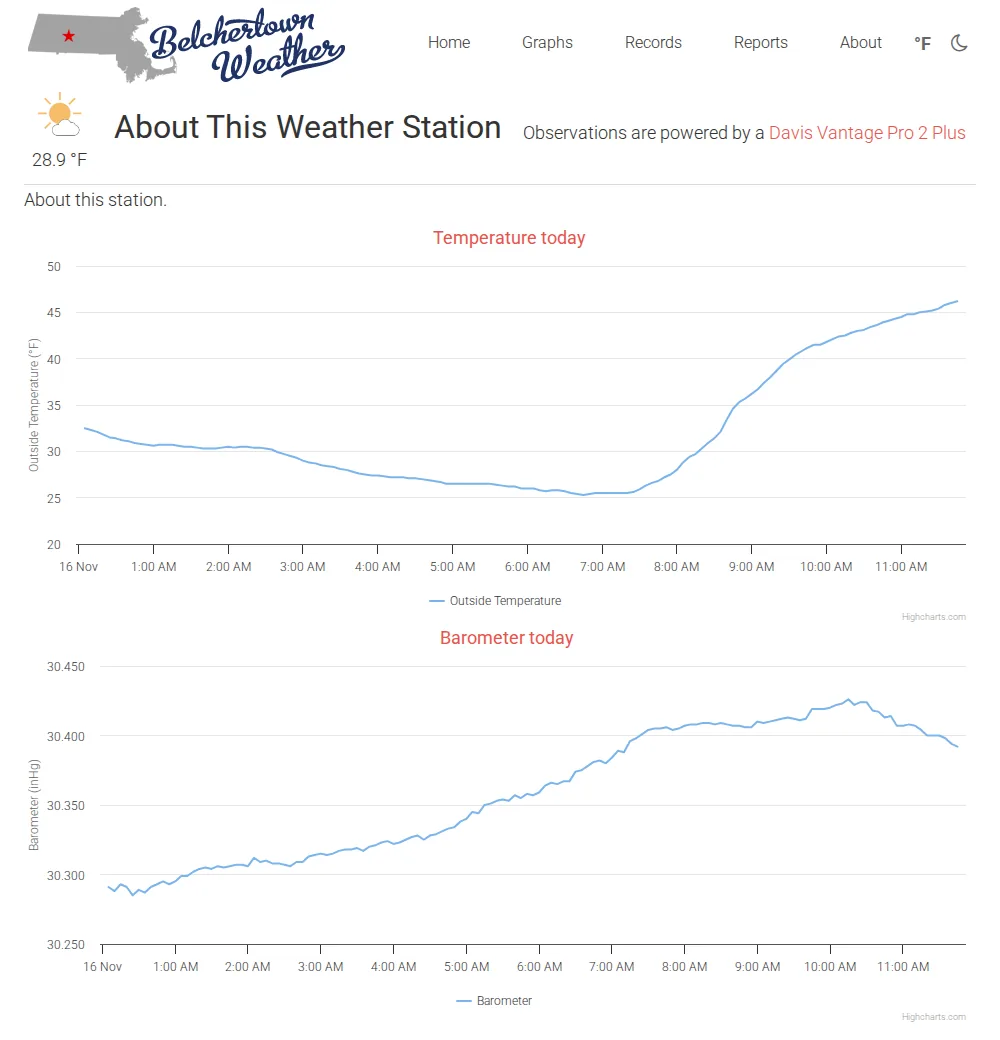
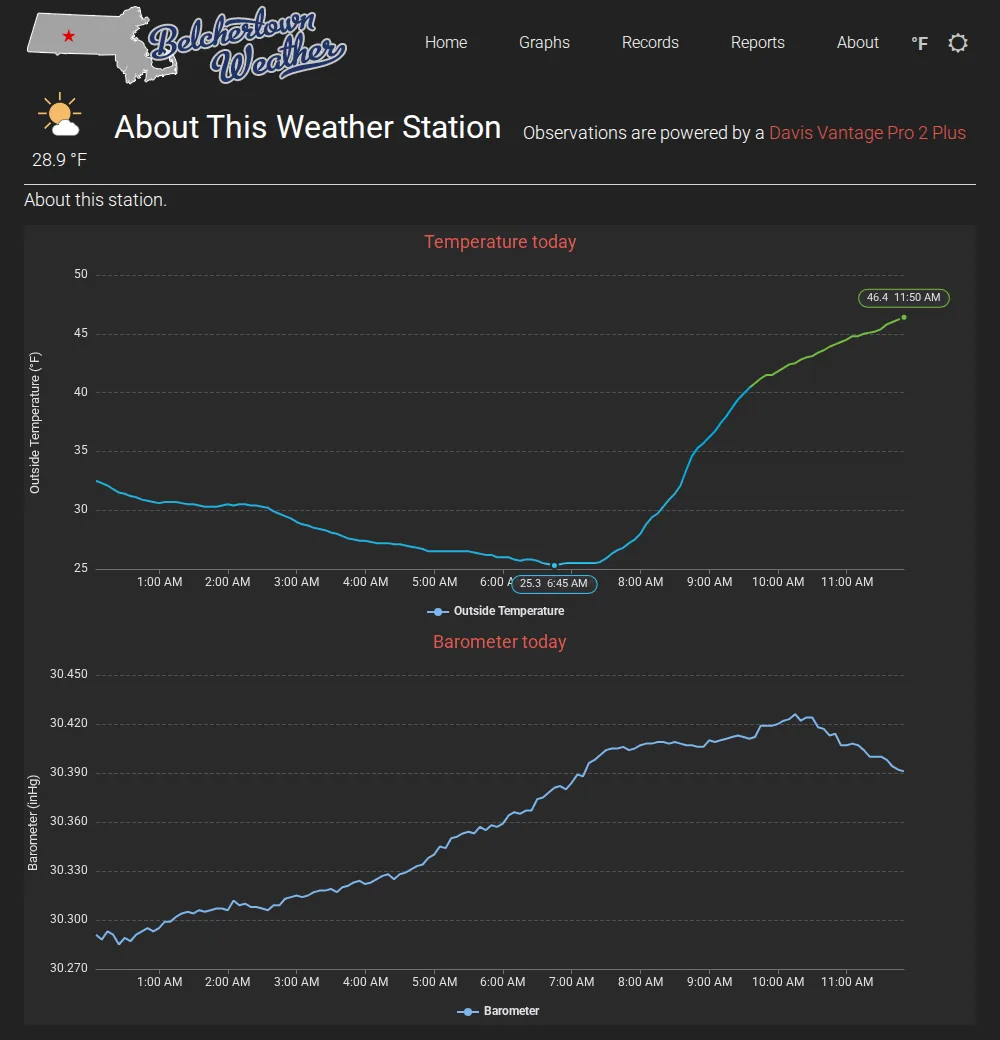
showChart takes the chart group name. Each chart's id must be unique on the page, so don't reuse names from the home page group (such as chart1) on a home page block. The charts follow the light and dark theme and the °F/°C button like the skin's own.
A chart you write yourself
For numbers that aren't in your weewx database, build the chart in a few lines of JavaScript with two of the skin's own functions:
chart_base_options()gives you the skin's chart settings: its fonts, colors, dark mode and tooltips.draw_chart(options)draws the chart with Highcharts or ECharts, whicheverchart_librarypicks.
The settings are written the Highcharts way (the Highcharts API describes them all). With ECharts, the skin translates the common ones: the chart type (line, spline, area, column, scatter), title, xAxis with categories or times, one or two yAxis with a title, min and max, and each series' name, data, color, yAxis, dashStyle, step and stacking. A setting it doesn't know is skipped, and the rest of the chart still draws.
This example, in about.inc, charts the snowfall of the last five winters:
<div id="snowchart" style="height: 400px;"></div>
<script>
var options = chart_base_options(false, true);
options.chart.renderTo = "snowchart";
options.chart.type = "column";
options.title.text = "Snowfall by winter";
options.xAxis = {categories: ["2021-22", "2022-23", "2023-24", "2024-25", "2025-26"]};
options.yAxis = [{title: {text: "Snow (in)"}}];
options.series = [{name: "Snowfall", data: [41.5, 22.0, 18.3, 35.9, 52.1]}];
draw_chart(options);
</script>
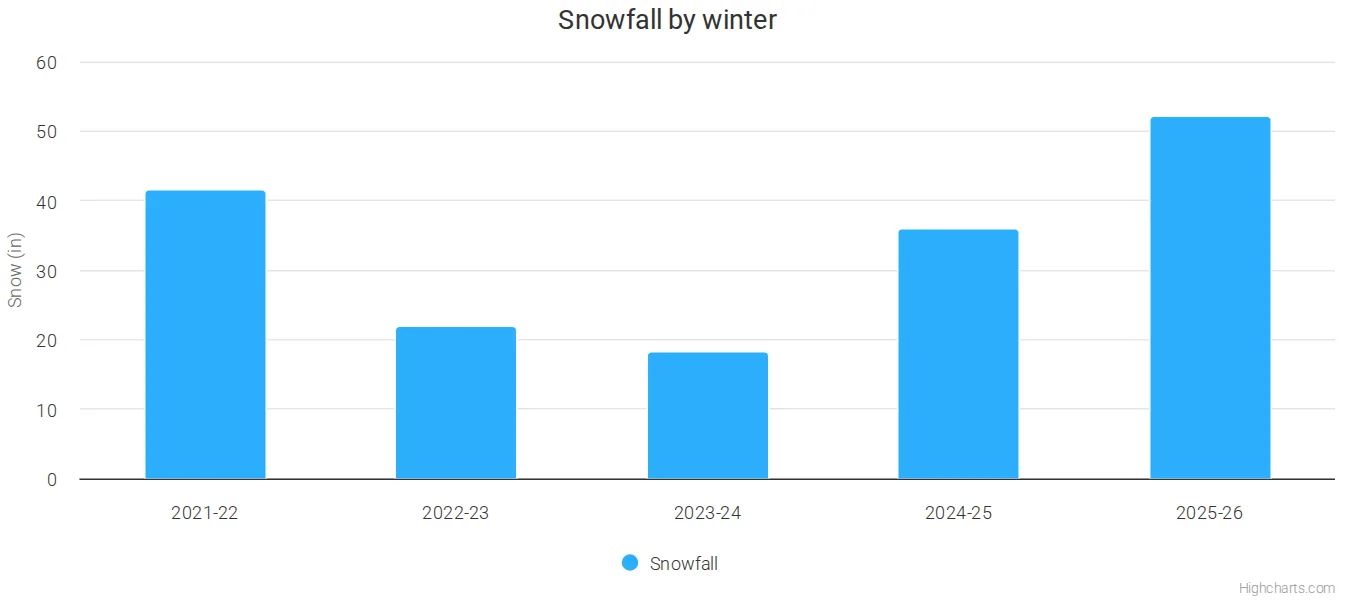
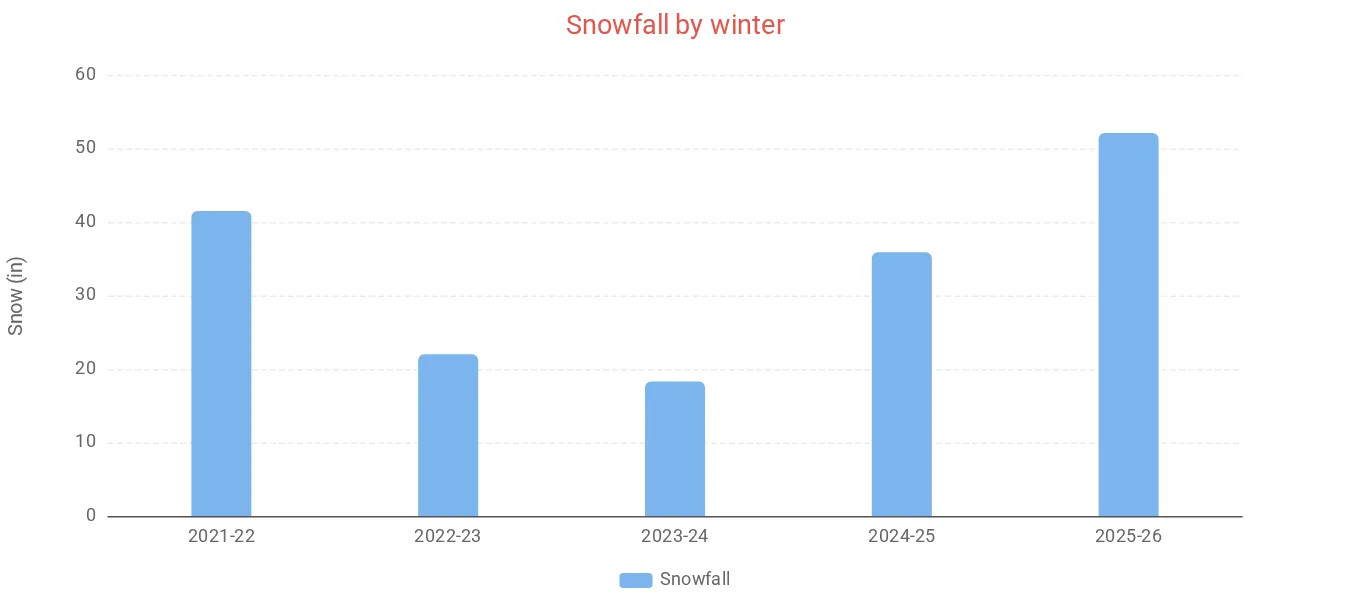
Always set options.chart.type: Highcharts draws nothing without it. chart_base_options(exporting, legend) takes two settings: true as the first adds the download button, true as the second shows the legend. For points in time instead of categories, leave out xAxis and give each point as [time, value], with the time in milliseconds since 1970 (a weewx time times 1000): data: [[1767225600000, 12.5], [1767312000000, 14.1]].
To read your numbers from a file instead of typing them in, put a JSON file in your website folder and fetch it first:
<div id="snowchart" style="height: 400px;"></div>
<script>
fetch("snow.json").then(function(r) { return r.json(); }).then(function(snow) {
    var options = chart_base_options(false, true);
    options.chart.renderTo = "snowchart";
    options.chart.type = "column";
    options.title.text = "Snowfall by winter";
    options.xAxis = {categories: snow.winters};
    options.series = [{name: "Snowfall", data: snow.inches}];
    draw_chart(options);
});
</script>
with snow.json holding {"winters": ["2024-25", "2025-26"], "inches": [35.9, 52.1]}.
Seeing what the skin builds
With debug mode on, the browser console shows the full settings of every chart the skin draws, which is a good starting point for your own.